
COVID-19 Dashboard
This dashboard is based on the following papers:
- Carli, R., Cavone, G., Epicoco, N., Scarabaggio, P., & Dotoli, M. (2020). Model predictive control to mitigate the COVID-19 outbreak in a multi-region scenario. Annual Reviews in Control. https://doi.org/10.1016/j.arcontrol.2020.09.005
- Scarabaggio, P., Carli, R., Cavone, G., Epicoco, N., & Dotoli, M. (2021). “Non-pharmaceutical stochastic optimal control strategies to mitigate the covid-19 spread,” IEEE Transaction on Automation Science and Engineering (accepted for publication). https://doi.org/10.36227/techrxiv.14413259
- Scarabaggio, P., Carli, R., Cavone, G., Epicoco, N., & Dotoli, M. (2021).“Modeling, estimation, and analysis of covid-19 secondary waves: the case of the italian country,” in 2021 29th Mediterranean Conference on Control and Automation (MED), pp. 794–800, IEEE. https://doi.org/10.1109/MED51440.2021.9480319
- Scarabaggio, P., Carli, R., Cavone, G., Epicoco, N., & Dotoli, M. (2021). “Modeling, estimation, and optimal control of anti-covid-19 multi-dose vaccine administration,” in 2021 IEEE 17th International Conference on Automation Science and Engineering (CASE), IEEE.
The last update of the model is July 1, 2022. The high number of vaccinated individuals require a modified version of this model available at 10.1109/MED51440.2021.9480319
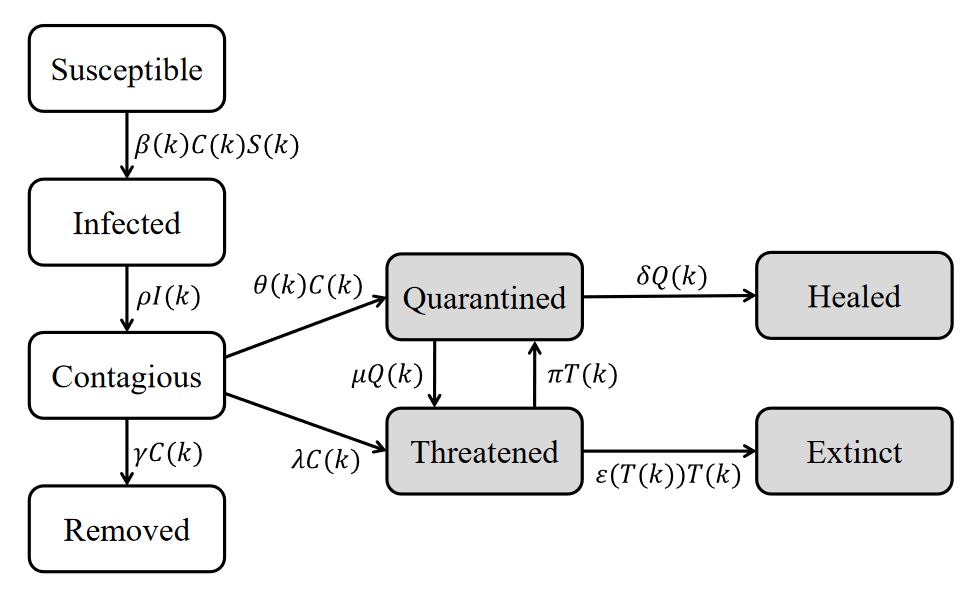
In this dashboard we collect the forecasting of quarantined, threatened, healed, and dead people for the Puglia region. Moreover, we collect other useful data and charts. The forecasting are made with a SIR-based model that takes into account:
S: Susceptible;
I: Infected (infected and undetected, however, not yet contagious);
R: Removed (undetected and completely recovered);
C: Contagious (infected and undetected, contagious);
Q: Quarantined (infected and detected)
T: Threatened (hospitalized in a life-threatening or noncritical situation);
H: Healed (completely recovered);
E: Extinct (dead).
The model equation are:
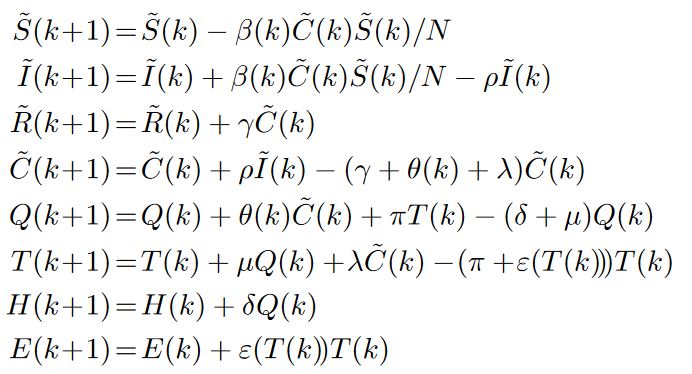
The model is updated regularly, and it takes the last days’ data to predict the next three weeks’ evolution for the quarantined, threatened, healed, and dead people. In the threatened chart, it is plotted an estimation of the maximum capacity of the health system, computed by 10*Number of ICU beds.
The old predictions are also shown to assess the model’s accuracy when the real data are available.
The model is based on the Department of Civil Protection database data and on the Google Mobility Reports. The latter are used to compute the so-called infection rate dynamically.
SIRCQTHE model – Puglia
Fitted parameters of the SIRCQTHE model